Understanding data products
"What exactly is a data product? " The concise answer is this: a data product is a product label and the digital object it describes. Now, let me explain.
Let's consider an image taken on Mars. Here is a nice one:
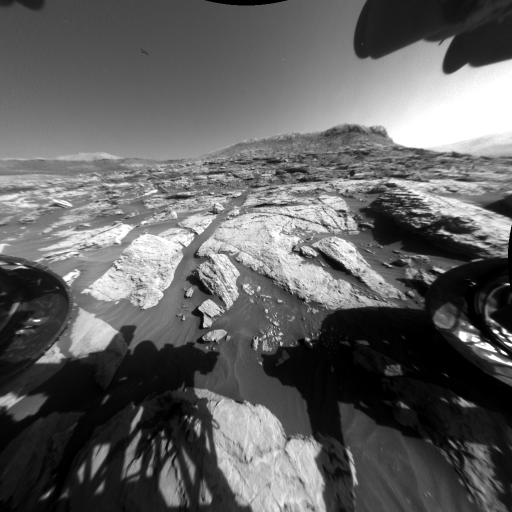
Our image is a bunch of zeros and ones to the computer, and we call the file that contains them a data file. In order to work with the image and understand it, we need some quantitative information, or metadata—data about the data. Examples of metadata are the size of the image, the date and time the image was taken, and how the camera was positioned. The file that contains the metadata is a label file. The combination of the label file and the data file is a data product. In many cases, a data product has one label file and one data file, although it is possible for one label to describe data stored in more than one data file.
Data in the Notebook are from the Planetary Data System archive and they are formatted according to the PDS4 data standard. PDS4 requires the data and label to be stored in separate files. (Data products from earlier PDS versions of the standard sometimes have the metadata prepended to the data, all of it in a single file.)
Product identifiers and filenames
Each data product has an identifier that is unique within the Planetary Data System archive. For data formatted using PDS4 standards, it is called the Logical Identifier, or LID, and is often combined with a Version Identifier (VID) to form a LIDVID. A PDS4 LIDVID is guaranteed to be unique across the whole PDS system. For PDS3 and earlier standards, the identifier is called the Product ID.
An example PDS4 LIDVID is shown below. A colon separates the individual parts of the LID, and two colons separate the LID from the VID.

| Component | Description | Example | ||
|---|---|---|---|---|
| LID | urn | The abbreviation for Uniform Resource Name. The value is always "urn". | urn | |
| agency id | The national agency responsible for archiving the data | nasa | ||
| archiving authority id | The agency's archiving authority | pds | ||
| bundle id | A group of one or more related collections | bopps2014 | ||
| collection id | A group of like products, such as the raw images from a camera, the calibrated products of a spectrometer, or the set of documentation about an instrument. | calibrated | ||
| product id | The identifier for the product within the collection | ceha_1_024109424_n011_0244e_fit | ||
| VID | version id | The version of the product. When two versions of the same LID exist, the higher version is expected to be the better one (e.g., corrections made or improved calibration applied). | 1.0 |
Usually, the product ID is the same as (or nearly the same as) the data filename, not counting the file extension. And almost all filenames are encoded with information about the observation that resulted in the product, like the instrument used and time of acquisition. You can read more about file naming conventions for Mars 2020, MER, MSL, and PHX.
The importance of label files
You might be wondering why a data file like the image above needs a label. After all, you don't have label files for your MP3 music and Word documents. The truth is that those files do have labels, but they are attached to the data in a single file. That's why you can only open the files with certain software that knows how to extract and separate the metadata and data.
Storing the label separately from the data makes sense. The NASA planetary data archive contains data collected over the past 50+ years from hundreds of instruments in hundreds of formats, and all of those data have to be described using a common system (the PDS standard). As a result, a researcher can read a label file without opening the data file. And a data provider can update labels without the risk of altering the data file.
The label plays another valuable role: providing context about data from a particular observation. Examples include the date and time of observation, the state of the instrument, and references to other data and literature references. The content of the label depends on the metadata produced during the observation and what the data provider chose to include. Even among instruments from a single mission, you may find differences in the types of metadata supplied.
Science data vs. operations data
Let's take a quick detour to consider why data products exist and why it's important to know.
-
Operations products are generated to support mission operations, produced in time to support planning on a daily basis. These data are of interest to researchers interested in machine vision and engineering operations. They are not intended for radiometric or photometric analyses of camera data, for example, but they are often the foundation of partially processed, calibrated, and derived data. (More on that in a minute.)
-
Science products are created to support detailed analyses such as radiometric and photometric studies.
Don't expect that every data product will have a science version and an operations version because that's not the case. At first, you probably don't need to be too concerned about whether you are looking at science or operations data. But if you are getting into data analysis, the difference can be important. Just keep it in mind. That leads us to a discussion on processing levels and product types.
Processing levels, product types, and product grouping
About processing levels
Science data in the Notebook are generated by instruments on spacecraft or in laboratories or observatories on Earth. They are processed, labeled, and delivered to PDS by mission instrument teams or by individual investigators. They range in processing level from the raw measurements recorded by an instrument to highly derived products such as topographic maps. The PDS4 processing levels are:
- Telemetry. Data output from an instrument into temporary storage. Not stored in PDS.
- Raw. Original data from an instrument that have been adjusted, if necessary, to conform to PDS4 standards.
- Partially processed. Data that have some processing applied, though not calibrated.
- Calibrated. Data converted to physical unite, making the values independent of the instrument.
- Derived. Results that have been distilled from one or more calibrated documents.
Data from earlier versions of the PDS standard, such as PDS3, used the terms Experiment Data Record (EDR) and Reduced Data Record (RDR) rather than the processing levels listed above. EDR products generally can be mapped to raw or partially processed whereas RDRs can fall with the range of partially processed, calibrated, and derived. A simple way to think of this is the EDR is the initial data from the observation, with little extra processing. From that, one or more RDRs can be derived.
You might see references to EDRs and RDRs, even in the most recent PDS4 data because some data providers have data processing pipelines (and mindsets) built on legacy standards. That also is true of the Notebook!
About product types
When an observation is made by an instrument, a raw data product is created. Often, additional processing is applied, resulting in one or more partially processed, calibrated, or derived products. Data providers sometimes classify the content of these data product by assigning a product type.
For example, below are a Curiosity left Front Hazcam raw data product (left) and one of the derived products (right) created from the raw product. The left image has the product type EDR. The right image has the product type RAD to indicate that it has been linearized and radiometrically corrected to absolute radiance units.
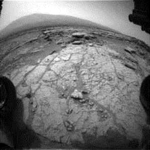

Data types can include raw products, housekeeping and ancillary data, calibrated data, and a variety of derived products. Knowing which data types are available can inform which are of interest to you. Remember that the content and format of data products from a single instrument can vary depending on the product type.
About product grouping
In the Analyst's Notebook, we group data products together to improve usability. The three categories are lead products, observation groups, and individual products.
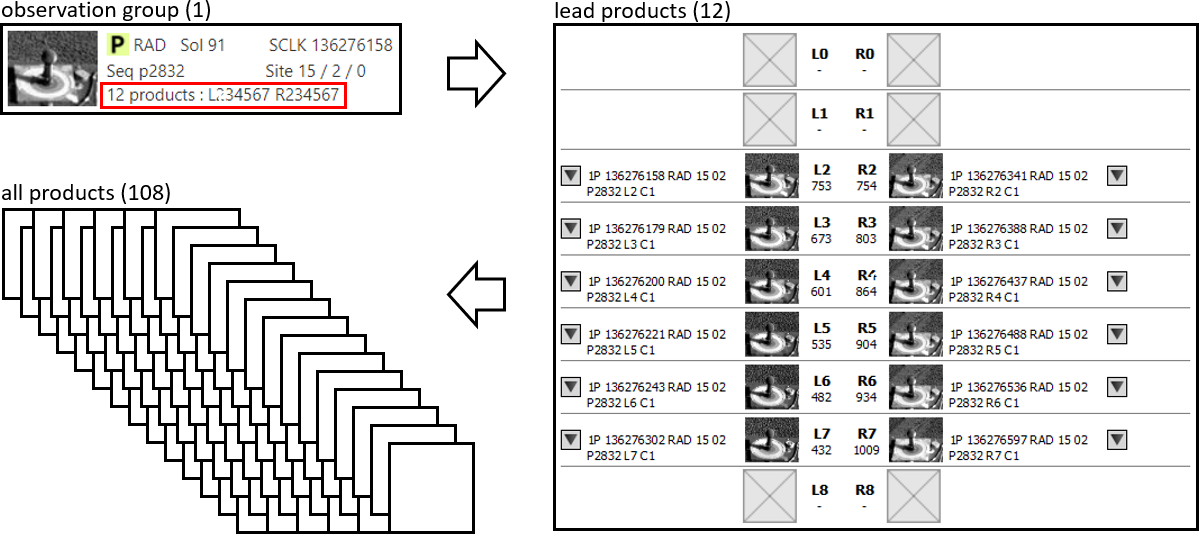
We just learned that an instrument team might create many derived products from a single raw product. Depending on the instrument, there may be several or even dozens of additional derived product types created from the same observation. For the example image above, the archive contains 106 raw and derived data products of various types! The Notebook designates one product type to be the lead product for a given observation.
The Notebook sometimes further consolidates observations from an instrument into an observation group. Examples include stereo navigation images acquired simultaneously, related MER Pancam, and Curiosity ChemCam data.
Sol summaries show data only as observation groups. Lead products and individual products can be selected from product detail pages and data search. This example shows how a single Opportunity Pancam L2 (left filter 2) image represents an observation group of 12 lead products (same observation but different camera filters) comprising 108 individual data products:
Data file formats
Despite the large number of data file formats in the archive, almost all of them can be described as either an array or a table in the label. For example, three spreadsheets might have differing numbers of rows and columns, but they all are tables. And images from different instruments might have data files with quite different structure, but the image data are arrays. It is the label that provides enough information for us or our software to read the data. When the data are in table form, the label describes the layout (format) of the table—the number of rows and columns, what each columns represents and how to interpret the data, etc. Likewise, when the data are in image form, the label describes the layout of the image and the format of the data values.
Details of science data product formats are provided in the data product SIS (Software Interface Specification). The SIS for a particular instrument can be found in the Mission and instrument data set documents (for MSL, MERA, MERB, and InSight) under the  Resources tab. After selecting an instrument, look in the Documents listing for the data product SIS.
Reading a label
A PDS4 label is divided into five main parts:
- XML Header. You don't need to worry about this part unless you are writing a script to systematically read label files. It contains links to local and remote schemas.
- Identification Area. This part has information that uniquely identifies the product.
- Observation Area . This part contains descriptions of the specific observation, laboratory experiment, etc.
- Reference List Area. Here you can find information on other products, journal articles, etc., relevant to understanding the data, both internal and external to PDS. Sometimes such references are listed elsewhere in the archive, such as a document common to all data from the instrument.
- File Area. This part has pointers to the component file(s), and detailed descriptions of them.
Labels are written in XML format, making them easy for software to process but not always easy for humans to read. Your first few attempts to read a label might be confusing or frustrating. Things will get better. Labels can be opened in any text editor, although an XML-aware editor will make the file easier for you to read. Microsoft Visual Studio Code is a good editor, freely available for Windows, Mac, and Linux platforms. It is enhanced by plug-ins that will colorize and format XML files for improved readability. (We don't get a kickback for this recommendation, but we do use the software!)
To read a label file that you have downloaded, simply open the file in your favorite text editor and start scanning. When looking at data products within the Notebook, you can view the label by selecting Product > PDS label from the product's menu.
If you haven't read XML before, you need to know these simple things:
- All XML information is stored in elements and attributes.
- An element has an opening tag and a closing tag in angle brackets, the latter beginning with a slash.
- An element can contain other elements. A child element is wholly within a parent element.
- An element can have attributes in the opening tag. Attributes are in the format keyword="value".
Here is an example XML snippet showing elements and attributes:
Getting the data file format from a label
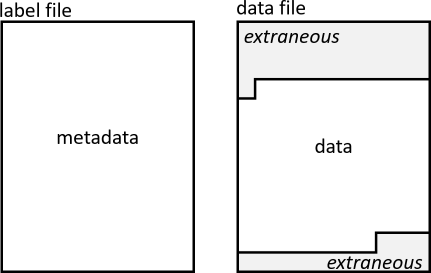
The label's File Area describes the data file format. Data files sometimes contain extraneous information such as engineering data or an alternate system header—information that you don't need or that can be found in the label. The data of interest is always in a single, contiguous block in the data file, as shown in this figure.
The label file points to the start of the data in the data file. Take a look at this snippet from an InSight lander image label:
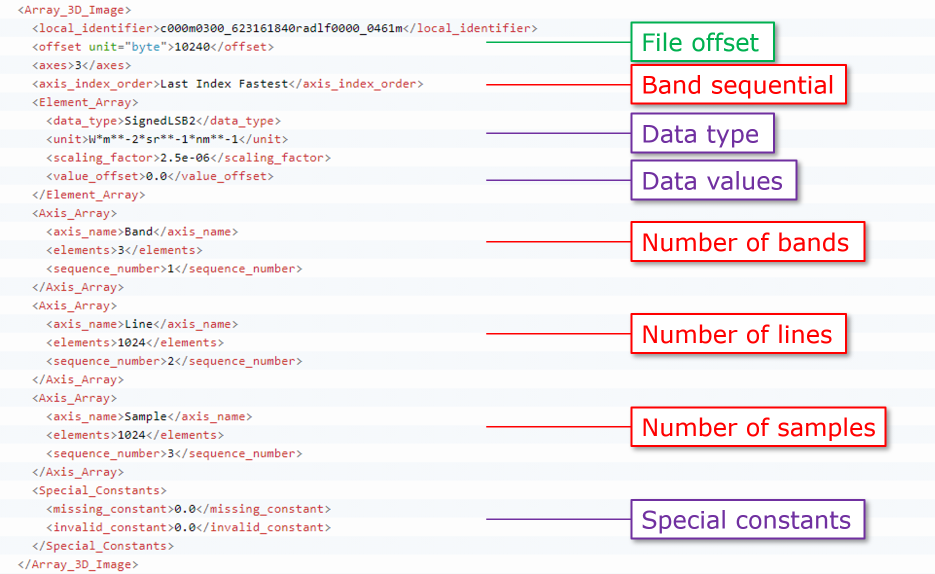
The element tag <Array_3D_Image> tells us that the data file contains a multi-band image . The value of the <offset> tag tells us where the image starts in the data file, i.e., we have to skip 10,240 bytes of data to get to the start of the image. Additional values describe the size of the image and the data type of the image pixels. See Image primer for discussion of these values.
The label for data in tabular form also describes the data file organization, but with different parameters. This snippet from an InSight lander table label reveals the data are in a CSV (comma-separated value) table format.
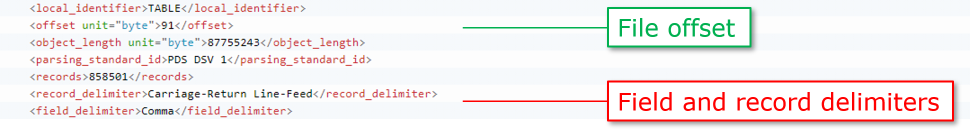
The elements <field_delimiter> and <record_delimiter> show that the fields (columns) of the tables are separated by a comma, and that records (rows) are separated by a CR/LF (carriage return/line feed). The <offset> value indicates that the table records begin after a 91-byte header in the data file. If you were to open this file in a program that recognizes CSV format, you wouldn't need to bother with this part of the label because the software already knows how to read the CSV structure. The label contains additional info that you will need, though.
Here is a bit more of the label for the same InSight lander table label. This part shows three of the table's field (column) definitions.

Each field is described in a separate <Field_Delimited> element. We see the name and a brief description of the field, as well as the field's data type. The third field in the example has data type ASCII_Real. This means that the field contains real numbers in ASCII rather than binary code. This field also has a <field_format> element that shows the format of the numbers in the field. The <field_format> element isn't required for the other two data types: an ASCII_String does not have a fixed format, whereas an ASCII_Date_Time_DOY_UTC has a rigid format that cannot change. You can find a listing of allowed data types on the PDS web site section on standards if you have questions. Or give us a shout and we can help!
Getting contextual information from a label
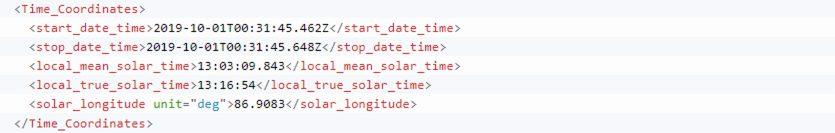
Aside from documenting the format of the data a label describes, a label's true value lies in the contextual information it provides about the data. Information like when and where the data were acquired, or the conditions of the instrument during observation, or the processing steps required to produce the data. These metadata are in the label's Observation Area.
This snippet from an InSight lander image label captures times relevant to that particular observation.
Take some time to look through the metadata for all kinds of treasures.
Viewing and working with data
The Analyst's Notebook provides browse versions of many data types and includes image viewing and measurement tools. For more complete analysis and research, you will want to download the data products and metadata labels to your local system.
Just like any other data you want to look at on your computer, you need a software program capable of displaying the data. Most software we use, like email and document writing programs, are not built to open or work with scientific planetary data. Some scientific programs are better than others at natively reading the data (that is, without some sort of translator). Many programs support manual input of data file formats.
Remember that converting data may render them unfit for science use. For example, converting a radiometrically corrected image to JPEG format often employs compression and reduces the dynamic range of the data values.
Here are some options to consider. Please contact us if you have trouble finding or using any of this software. (For entries marked [REGISTRY], consult the PDS Tools Registry at https://pds.nasa.gov/tools/tool-registry/ For all others, search online for the latest version.)
- Free
- The PDS4 Viewer is a general visualization tool that can read all types of PDS4 data. [REGISTRY]
- The PDS Transform tool is a Java-based command-line tool for transforming PDS3 and PDS4 product labels and data into other formats. [REGISTRY]
- GDAL is a translator library for raster and vector geospatial data formats. [REGISTRY]
ISIS is the USGS software package designed to ingest and manipulate image data from past and current NASA and many international planetary missions that have visited bodies in the Solar System. [REGISTRY]
- Microsoft Visual Studio Code can read XML metadata labels and a variety of ASCII text files.
- Commercial
- ESRI ArcGIS supports some PDS images natively with the option to manually enter format details.
- Harris Geospatial ENVI/IDL supports some PDS images natively with the option to manually enter format details.
- MathWorks MATLAB can be used for numeric processing of image and tabular data. Format details must be manually entered.
- Microsoft Excel and related programs can read many PDS ASCII tables in CSV format.
Details of science data product formats are provided in the data product SIS (Software Interface Specification). The SIS for a particular instrument can be found in the Mission and instrument data set documents (for MSL, MERA, MERB, and InSight) under the Resources tab. After selecting an instrument, look in the Documents listing for the data product SIS.
see also
- Read the Image primer for more about images.
- Read about file naming conventions.